
First Quarter 2026 Market Recap
Geopolitical Headwinds in 2026
- Escalating tensions in the Middle East sent energy prices sharply higher during the quarter, with US gasoline rising above $4.00/gallon nationally for the first time since 2022.
- Rising energy prices during the quarter put the Federal Reserve’s rate cuts on hold for the near-term, with investors now pricing in zero interest rate cuts in 2026.
- During the quarter, almost all major stock markets fell between 8% and 10% from their 2026 high levels, due in large part to the rise in energy prices and lower likelihood of interest rate cuts.
- Underlying fundamentals were still strong heading into the start of the conflict in Iran, despite weakness in AI-related equities and private credit.
What Happened in the First Quarter?
Equity markets started 2026 on a strong note, with broad equity market leadership and participation. That changed in late February, with the start of the conflict with Iran, causing energy prices to rise sharply higher. This introduced volatility into the broad equity and fixed income markets, with most major equity markets experiencing a correction from their high levels in January (correction is a decline greater than 10%). However, some equity markets fared better during the first quarter: large cap value (Russell 1000 Value TR Index, +2.10%) and small cap stocks (Russell 2000 TR Index, +0.89%) captured less downside than large cap growth (Russell 1000 Growth TR Index, -9.78%), for example. International equities, which started 2026 on a strong note, suffered from a strengthening US dollar and higher energy prices, pushing the markets lower in March and mildly lower for the quarter (MSCI ACWI Ex-USA NR USD Index, -0.71% for the first quarter)
The market’s expectations of the oil supply disruption have not reduced corporate earnings expectations yet- earnings estimates have actually risen through quarter-end. This resulted in stocks becoming cheaper this month: S&P 500 is down -5% in March, but with 2026 earnings expectations increasing, has taken the forward P/E ratio to roughly 19x forward earnings (peaked over 23x in October 2025).
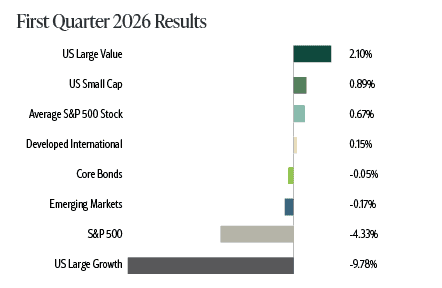
Sources: Morningstar, Average S&P 500 Stock = S&P 500 Equal Weighted TR Index, US Large Caps = S&P 500 TR Index, US Small Cap = Russell 2000 TR Index, Developed International = MSCI EAFE NR Index, Emerging Markets = MSCI Emerging Markets NR Index, Core Bonds = Bloomberg US Agg Bond TR Index, US Large Growth = Russell 1000 Growth TR Index, US Large Value = Russell 1000 Value TR Index
The bond market experienced a month of positive correlation to the stock market in March: core bonds decline with equities, albeit to a lesser degree (Bloomberg Barclays Agg Bond TR Index fell -1.76% in March, taking 1Q2026 to -0.05%). This was primarily because of the short-term increase in inflation expectations due to rising energy costs, which reduce the probability of interest rate cuts in 2026. As of 3/31/2026, futures markets were pricing zero interest rate cuts from the Federal Reserve, a sharp change from the start of 2026. Also, within fixed income, private credit investments continue to come under pressure from significant investor redemptions, as investors become cautious on the asset class after years of significant asset growth.
Other diversifying asset classes also struggled. After a strong 12-18 months, gold prices declined in March (Spot gold prices declined -10.85% during the month). Cryptocurrencies faired modestly better in March but are still experiencing a challenging period: Bitcoin rose +3.38%% in March, but is still down -22.55% in 2026.
Equity Markets & Energy Shocks
The current supply disruption of oil (and natural gas) is the most significant in history, with nearly 20% of the world’s daily oil supply being removed from the market. This has pushed energy prices sharply higher: the price of Brent crude oil rose over 55% higher March, the largest monthly percentage increase in its history. Naturally, the relationship between equity markets and energy shocks has come into focus in 2026.
It is important to note that this relationship has evolved somewhat over time: for example, the United States is the largest single country producer of oil and natural gas today (22% share), an increase from the energy shocks of the 1970’s. Energy sensitivity at the consumer level is also lower today compared to 50 years ago: energy expenditures as a share of disposable income was roughly 5.9%, compared to the 1984 peak of 10% of disposable income.
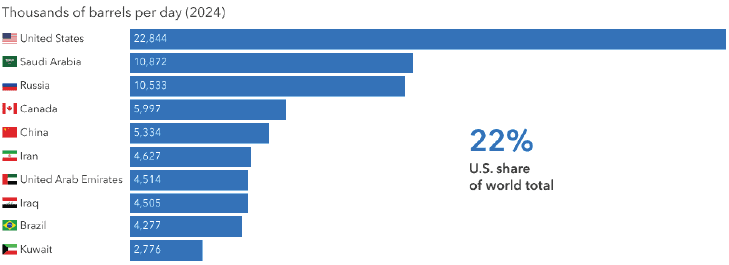
Sources: Capital Group, U.S. Energy Information Administration. Data includes petroleum and other liquids such as biodiesel, ethanol, liquids produced from coal, gas, and oil shale, Orimulsion, blending components, and other hydrocarbons. Latest data available is 2024 as of February 28, 2026.
Looking at seven oil shocks since 1990 (not counting the present), the S&P 500 has typically traded lower following the start of the rise in oil prices. However, one year after the disruptions, the S&P 500 has averaged a 12% return. The greater question is whether the supply shock is severe enough to push the economy into a recession (similar to the 1970s episode), which could result in greater downside for the S&P 500. Prompt resolution to the significant supply shock is paramount to equities following the underlying fundamental strength they had to start 2026.
What’s Ahead for the Second Quarter?
Investors will be closely monitoring for any potential resolution of the oil supply shock; prolonged remove of supply risks pushing energy prices even higher. The higher energy prices have moved short-term inflation expectations higher, which is expected to keep the Federal Reserve from cutting rates in the Second Quarter and beyond. Mid-term elections are also inching closer, which historically has been a source of short-term volatility for equity markets.
Relative weakness in Technology and AI will also be closely watched by investors: expected AI-related capital expenditures in 2026 nearly reached a massive $700bn but may be showing signs of having peaked. Related to this is the on-going pressure in the private credit space, which grew significantly in size over the last five years.
Overall earnings are still expected to be strong – nearly 13% earnings growth expected for 1Q2026 (which will be released during the second quarter). Earnings have bucked the energy shock to date, likely reflecting expectations of a prompt resolution.
*Past performance is not indicative of future results. The S & P 500 Index is a broad, unmanaged index of 500 of the largest US publicly traded companies and does not reflect the impact of fees, taxes or expenses. Any investment in the S&P 500 or similar indices, like the Russell 1000 and Russell 2000, involves risk, including the potential loss of principal and they do not reflect the costs of investing in an actual portfolio. Investors should consider their individual risk, tolerance, investment objectives, and consult with a financial professional before making investment decisions.