As Chief Investment Officer at Confluence Financial Partners, Bill Winkeler, CFA, CFP® oversees the firm’s investment philosophy, portfolio construction, market research, and overall investment strategy. Each quarter, he provides perspective on the market environment, key economic developments, and investment trends to help investors better understand what is shaping the financial landscape.
The commentary below is intended for educational and informational purposes and should not be considered personalized investment advice.
Month in Review
- July was a choppy month for equity markets, which saw some pockets of volatility as corporate earnings continued to strengthen, and oil prices rose +20% during the month.
- Despite a flat month for the S&P 500 (-0.06%, S&P 500 TR Index), market leadership continued to rotate under the surface, leading to larger pockets of dispersion.
- Large cap growth fell -4.76% (Russell 1000 Growth TR Index), while large cap value rose +3.82% (Russell 1000 Value TR Index) in July. The weakness in semiconductors and AI-related companies explains some of this differential: the Philadelphia Semiconductor TR Index fell -20.8% in July (largest monthly decline since 2008).
- Long-term bond yields pushed the yield curve higher in July, rising sharply following Kevin Warsh’s press conference after the July FOMC meeting. The yield of the 30-year US Treasury bond hit a post-2007 high of 5.27% during the month.
Earnings Driving Stocks in 2026
The S&P 500 TR Index has returned +10.14% in 2026 through 7/31/2026, and 100% of that return is from dividends and earnings growth. In contrast to recent years, the index’s valuation has actually declined: the S&P 500’s forward P/E ratio was 22.0x on 12/31/2025, and fell to 19.6x as of 7/31/2026. This valuation contraction represents a drag on the index’s returns in 2026.
This shows the strength of earnings growth in 2026. Analysts now expect 2026 earnings for the S&P 500 to grow nearly 30% year/year, having revised growth forecasts sharply higher from the start of 2026. They also expected 13% growth in 2027 and 14% growth in 2028.
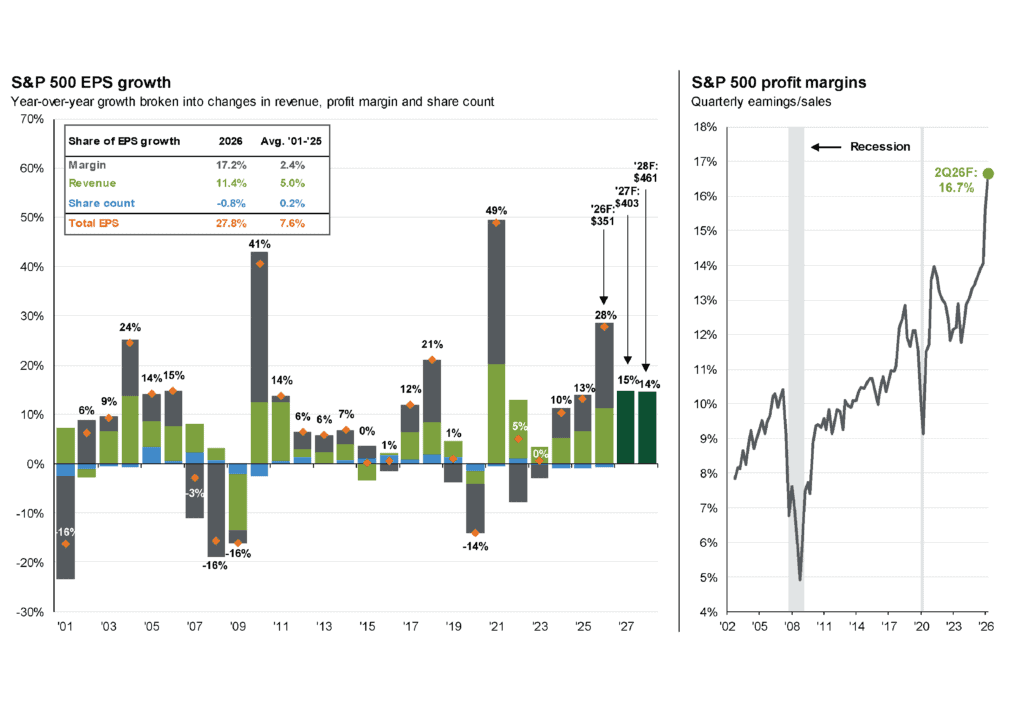
Source; Compustat, FactSet, Standard & Poor’s, JPMorgan Asset Management. Historical EPS values are based on actual annual EPS. As of 7/31/2026
The forecasted earnings growth of 30% would be the strongest earnings growth in the last 25 years, outside of post-Pandemic and post-Global Financial Crisis. AI investment represents a significant portion of the forecasted earnings growth, highlighting the increasing importance for the stock market and economy.
What’s on Deck for August?
Monetary policy will be in focus, with investors looking for signposts from the Federal Reserve ahead of the September FOMC meeting. The changing communication style was an adjustment for investors, responding to the uncertainty by sending long-term bond yields to 20-year highs. As of 8/3/2026, Fed Fund futures markets are pricing a 62% probability of a 0.25% rate hike at the September 16, 2026 FOMC meeting.
*Past performance is not indicative of future results. The S & P 500 Index is a broad, unmanaged index of 500 of the largest US publicly traded companies and does not reflect the impact of fees, taxes or expenses. Any investment in the S&P 500 or similar indices, like the Russell 1000 and Russell 2000, involves risk, including the potential loss of principal and they do not reflect the costs of investing in an actual portfolio. Investors should consider their individual risk, tolerance, investment objectives, and consult with a financial professional before making investment decisions.