Value and international equity markets continued their strength in February, extending the strong start to 2026 for diversified portfolios.
The S&P 500 TR Index declined -0.76% for the month, with technology and growth stocks again weighing on the index. Large cap growth stocks declined -3.36% in the month of February, taking 2026 returns to -4.82% (Russell 1000 Growth TR Index)
Equities outside of large cap growth again showed strength. Within the large cap space, value rose +2.59% in February (Russell 1000 Value TR Index), small caps rose +0.80% (Russell 2000 TR Index), and international equities led major equity indices at +5.02% during the month (MSCI ACWI Ex-USA NR USD Index)
Bond markets benefitted from a decline in interest rates across the yield curve, driving the core bond index to a strong +1.64% monthly gain (Bloomberg Barclays US Aggregate Bond TR Index)
Stock Market & Geopolitical Events
One of the more well-known investing adages is the “stock market climbs a wall of worry”, which is particularly appropriate for times of geopolitical conflict such as the present.
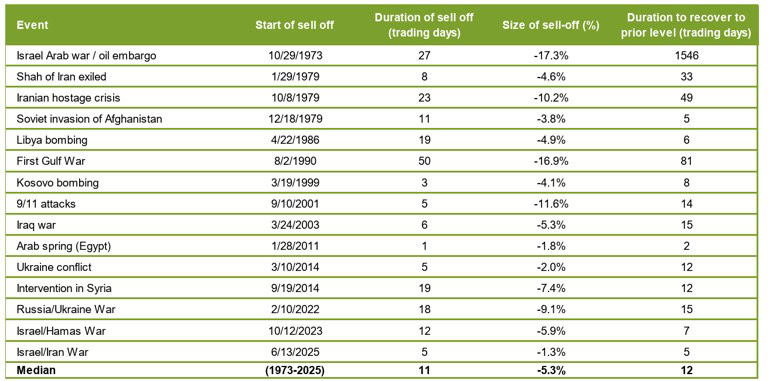
Acknowledging the human impact of geopolitical events, history shows that the impact to equity markets tends to be short-lived. Looking at the period since the S&P 500 was incepted, excluding the present conflict in Iran, the S&P 500 has declined an average of -5.3% over 11 trading days following the start of major geopolitical events (shown in the table below).
Historically following the initial sell-off, investors digest the fundamental impact to the stock market (which tends to not be long-lasting in nature), and the stock market exhibits some symmetry – recovering the initial loss in an average of 12 trading days. While conflicts like the present can exhibit immense human cost, history shows that the stock market will continue to climb the wall of worry.
S&P 500 Selloffs Around Geopolitical Events
What’s on Deck for March?
The Federal Reserve meets on March 18th, but as of the time of writing, investors are pricing in a 97% probability of no interest rate cuts. Current pricing indicates expectations of two 0.25% rate cuts in 2026.
Following earnings season, expectations for capital expenditures on AI technologies reached new extremes. The five “Hyperscalers” (Amazon, Alphabet, Meta, Microsoft, Oracle) have guided roughly $700bn of capex in the next 12 months. If realized, this would be one of the larger investment outlays relative to GDP in modern history (~2% of GDP). Investors are paying close attention to efficacy of this record investment.
Diversification was the name of the game in January, with value stocks, small cap stocks, and international stocks leading markets higher, as the S&P 500 finished January up +1.45% (S&P 500 TR Index)
Weakness in Technology stocks continued for the second straight month, causing the large cap growth stock index to fall -1.51% in January (Russell 1000 Growth TR Index). In contrast, large cap value stocks started 2026 strongly, with the Russell 1000 Value TR Index rising +4.56% in January.
Small caps and international stocks continued their strength as well, with the small caps rising +5.35% (Russell 2000 TR Index) and international stocks rising +5.98% (MSCI ACWI Ex-USA NR USD Index) in January.
Bond markets were nearly unchanged during the month (+0.11%, Bloomberg Barclays US Aggregate Bond TR Index), as investors balanced the steady decline in inflation with the nomination of a new Federal Reserve leader.
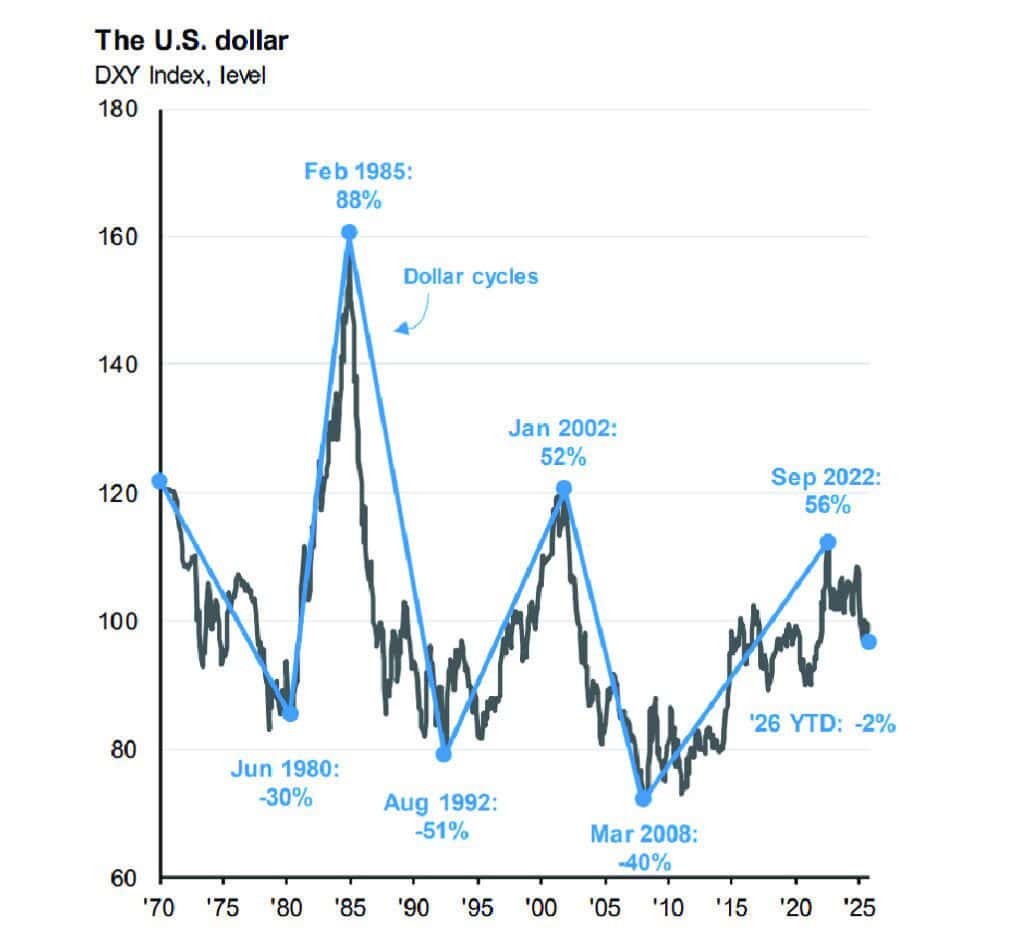
US Dollar Continues to Weaken
The US dollar continued to decline versus major currencies in 2026, falling roughly -2% in January. The decline in 2026 follows-up a decline of 9.4% in 2025, which was the worst calendar year for the dollar since 2017. There are many potential causes to the decline over the past 13 months, such as: changes in interest rates, starting valuation of the dollar, and changes to the fiscal outlook for the United States. The decline also has tangible impact on stock and bond markets, particularly coming off of a bull market for the dollar that lasted from March 2008 to September 2022.
For stock markets globally, the effect of the decline is two-fold. For US-based companies, especially large cap stocks in indices such as the S&P 500, a weakening dollar does boost earnings growth for these companies (unlike the US economy, S&P 500 Index generates 30% of sales from overseas).
For international equity markets, it has been a boon for US-based investors. US-based investors owning international stocks have three sources of return: share price + dividend yield + currency impact. The depreciation of the dollar added almost 8% to the return of the international stock market for US-based investors in 2025 (+32.39% in 2025, MSCI ACWI Ex-USA NR USD Index). This continued in January with a roughly 1.4% boost via currency (+5.98% in January, MSCI ACWI Ex-USA NR USD Index). Continued weakening of the US dollar could be a positive factor for US investors that own international stocks. For commodities and currency alternatives, dollar weakness has been a mixed bag: gold shined (+9.31% in January, S&P GSCI Gold Spot Index), while Bitcoin struggled (-4.29% in January, S&P Bitcoin USD).
Source: Bloomberg, FactSet, J.P. Morgan Asset Management; Currencies in the DXY Index are: British pound, Canadian dollar, euro, Japanese yen, Swedish krona and Swiss franc.
What’s on Deck for February?
Earnings seasons covering the fourth quarter of 2025 continues in February, with the majority of the Index’s market capitalization reporting in late January and early February. AI-related investment and consumer strength will be the key themes watched by investors.
The Federal Reserve Open Market Committee (FOMC) held interest rates constant in January. Kevin Warsh was nominated to serve as the next Chairman of the Federal Reserve – he will begin the confirmation process.
The longest government shutdown in history, slowing job creation, and concern over sustainability of AI investment did not slow down equity markets in the Fourth Quarter.
Record concentration in the S&P 500 in the US, driven in large part by the enormous spending on AI, caused some volatility during the quarter. Market concentration will likely be closely watched by investors in 2026.
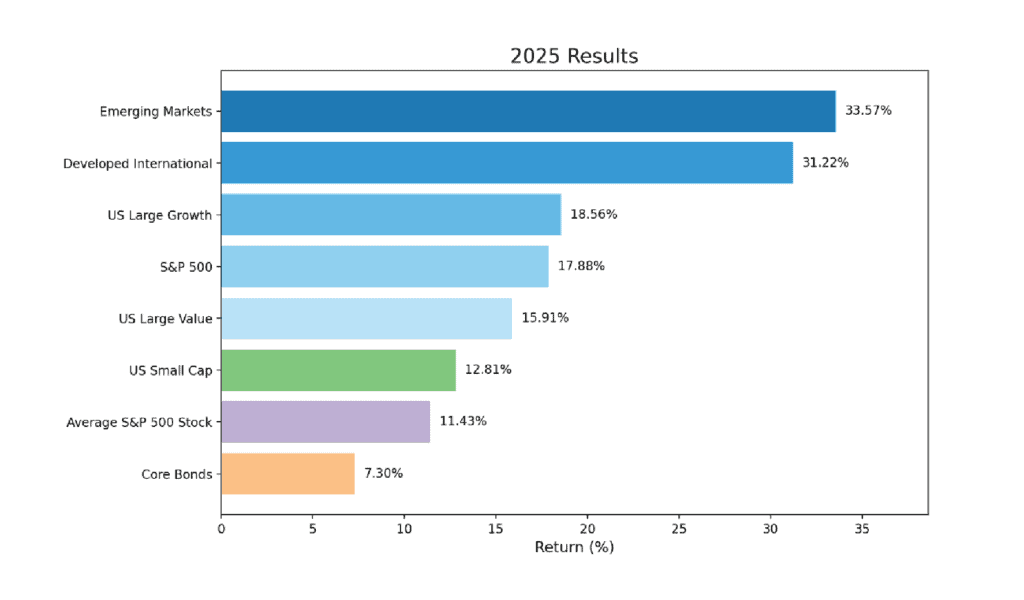
Ultimately, stock and bond markets finished 2025 on a high note, particularly for diversified investors: international equity markets posted strongest relative results to the US in over 30 years.
Strong finish and year was supported by fundamentals: higher earnings growth internationally, and strong earnings in the US that allowed the market to “grow” into historically expensive valuations.
What Happened in the Fourth Quarter and 2025?
The Fourth Quarter of 2025 finished on a strong note, with all major equity markets finishing in positive territory. This is despite an increase in volatility in October and November, following the longest government shutdown in US history, and investor concern around the sustainability of the massive investment in Artificial Intelligence. The government shutdown resulted in some economic data being suspended, but alternative measures showed that the economy was creating fewer jobs during the fourth quarter. In the stock market, strong earnings were the name of the game throughout 2025- outside the US, there was a strong embrace of fiscal stimulus, which powered earnings growth higher in Europe and Japan. The stronger-than-expected earnings growth, along with a weakening US dollar, resulted in international equity markets having their best relative results to the US since 1993 (via MSCI World Ex-US Index and S&P 500 Index). In the US, the S&P 500 started the year historically expensive and stayed that way throughout 2025, ultimately producing a third consecutive year of double-digit gains (historically rare occurrence). The S&P 500’s valuation largely stayed constant during 2025, reflecting strong growth in earnings that was responsible for nearly all of the index’s 2025 results. The growth-driven market did result in the trailing dividend yield on the S&P 500 Index hitting its lowest point since 2000 (1.20%), in contrast to higher yielding international equity markets.
Sources: Morningstar, Average S&P 500 Stock = S&P 500 Equal Weighted TR Index, US Large Caps = S&P 500 TR Index, US Small Cap = Russell 2000 TR Index, Developed International = MSCI EAFE NR Index, Emerging Markets = MSCI Emerging Markets NR Index, Core Bonds = Bloomberg US Agg Bond TR Index, US Large Growth = Russell 1000 Growth TR Index, US Large Value = Russell 1000 Value TR Index
The bond market was a benefactor of falling inflation and interest rate cuts from the Federal Reserve, resulting in the bond market (Bloomberg US Agg Bond Index) having its strongest calendar year since 2020, finishing comfortably above cash for the year. Short-term interest rates have fallen faster than long-term interest rates (“steepening yield curve”), as the Fed delivered three rate cuts in 2025 (following three cuts in 2024). Investment grade and high yield bonds also had a strong quarter and year, with spreads falling to low levels as the economy continued to grow. The outlook for additional rate cuts shifted during the quarter, with a roughly 60% chance of a 0.25% rate cut in March 2026 priced by the market (as of 1/1/2026).
All About Artificial Intelligence
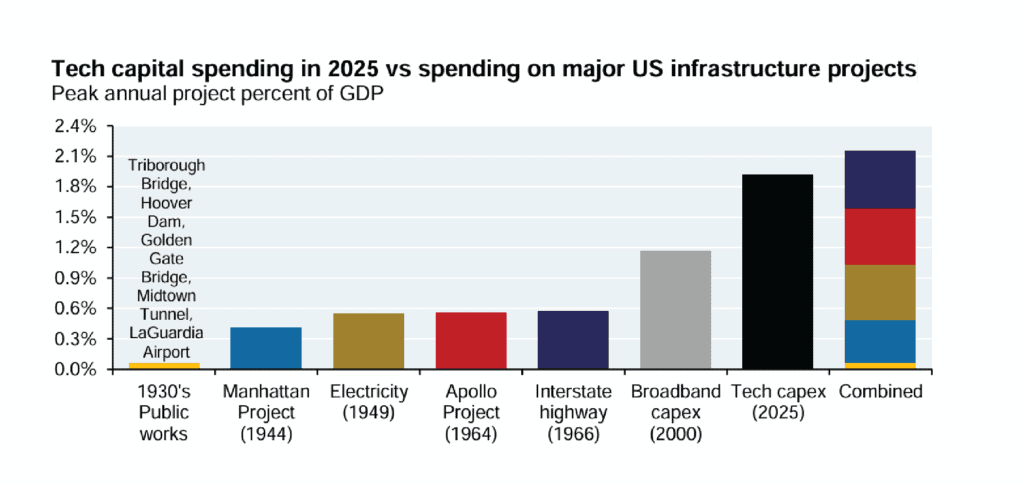
The investment in Artificial Intelligence technologies is on track to be the largest investment in US infrastructure in 100 years. The magnitude of investment had an impact on both the economy and stock market in 2025. For example, the chart below illustrates capital expenditures by the Technology sector as a percentage of US gross domestic product (GDP). It compares the current investment in AI technologies to other major infrastructure investment cycles historically – the current is significantly higher than the amount invested in Interstate highways and the Apollo Space Project, for example.
Source JPMorgan,: Manhattan District History, BEA, Planetary Society, Eno Center for Transportation, San Francisco Fed, Hoover archives, Baruch, GoldenGate.org, New York Times
This had a tangible impact on economic data: investment in AI data centers was responsible for almost all of the economic growth in the first six months of 2025, more than consumer spending which is 2/3 of long-term GDP growth!
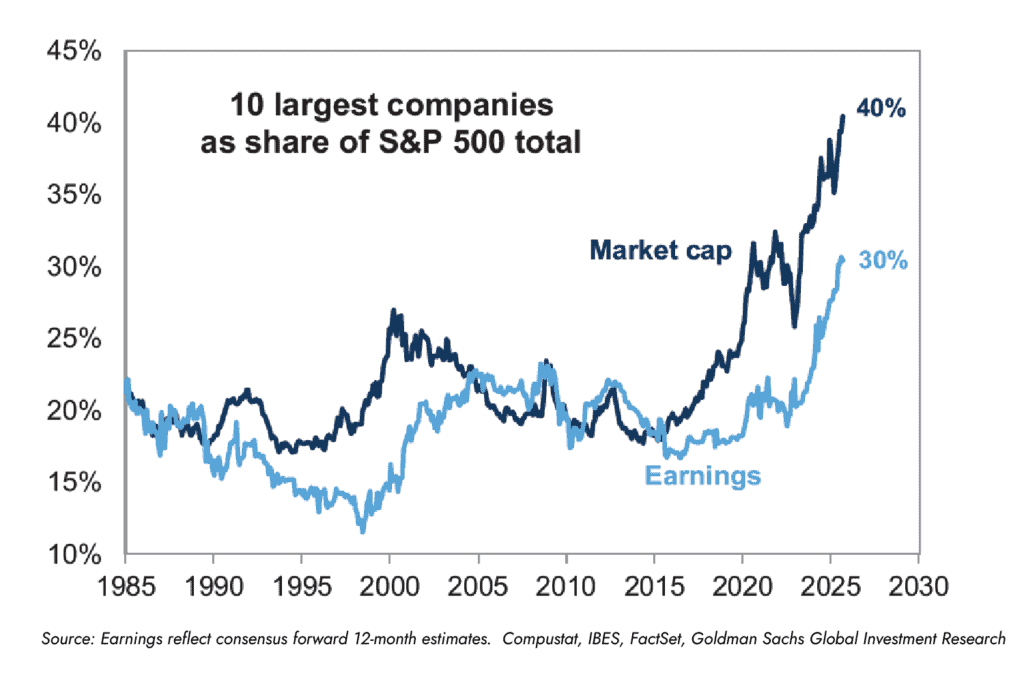
As discussed in previous editions of Market Pulse, the massive investment from Technology companies has also had a profound impact on equity market results and composition. In the United States, this has meant an increasingly concentrated equity market (over 40% of the S&P 500’s value is in ten companies), and a continuation of the outperformance of larger companies versus smaller companies. For example, the S&P 500 has outperformed the S&P 500 Equal Weight Index (average stock) by 34% over the past 3 years, the widest 3-year performance gap in history. US large cap stocks also outperformed small cap stocks in 2025, marking the 5th consecutive year of large cap outperformance. Investors expect there to be benefit to other companies within the stock market, forecasting a narrowing gap of earnings growth between the 10 largest companies and the rest of the stock market.
What’s Ahead for the First Quarter?
Investors will be watching for early clues in the tug-of-war going on between slowing job growth and expectations of a reaccelerating economy through the stimulus from the One Big Beautiful Bill Act (OBBA). The latter is expected to produce higher-than-average Federal tax refunds, which should be a boost to consumer spending. On the other side, expectations are for job growth to slow to under 50,000 new jobs per month, one sign the economy is slowing down. Inflation is a key reason the market is only expecting one 0.25% rate cut in the first quarter: core inflation is falling but remains stubbornly above the Federal Reserve’s target level of inflation. The equity market is coming off another year of strong results: the S&P 500 had double digit returns for three consecutive years for just the 9th time since 1928. Investors will look for signs of broadening participation from smaller companies, and improvement in earnings growth outside the mega-cap Technology companies.
Past performance is not indicative of future results. The S & P 500 Index is a broad, unmanaged index of 500 of the largest US publicly traded companies and does not reflect the impact of fees, taxes or expenses. Any investment in the S&P 500 or similar indices, like the Russell 1000 and Russell 2000, involves risk, including the potential loss of principal and they do not reflect the costs of investing in an actual portfolio. Investors should consider their individual risk, tolerance, investment objectives, and consult with a financial professional before making investment decisions.
A review of November’s markets, including AI hyperscaler volatility, bond trends, and what to watch at the December Fed meeting.
November 2025 Market in Review: AI investment, Bond Performance, and Equity Markets
Month in Review
The shifting economic outlook and renewed attention to the magnitude of artificial intelligence (AI) investment made for a volatile month for equity markets.
US large caps managed to finish the month slightly in “the black” (S&P 500 TR Index; +0.25% in November), despite Technology stocks falling -4.3% during November (S&P 500 Information Technology Sector Index).
The weakness in Technology stocks weighed on large cap growth stocks, which fell -1.81% during the month (Russell 1000 Growth TR Index), while large cap value stocks rose +2.66% in November (Russell 1000 Value TR Index).
The shifting interest rate outlook was a tailwind to major bond markets, with the Bloomberg Barclays Aggregate Bond TR Index rising +0.62% during the month, taking 2025 returns to +7.46%.
AI Hyperscalers Pullback
AI-related companies, including the so-called AI-“Hyperscalers”, sparked an increase in volatility and a pullback of -5% at one point for US large cap stocks in November. While pullbacks of this magnitude are very common, investors appear to be paying close attention to the rapid increase, and shifting make-up, of the capital expenditures on artificial intelligence technologies.
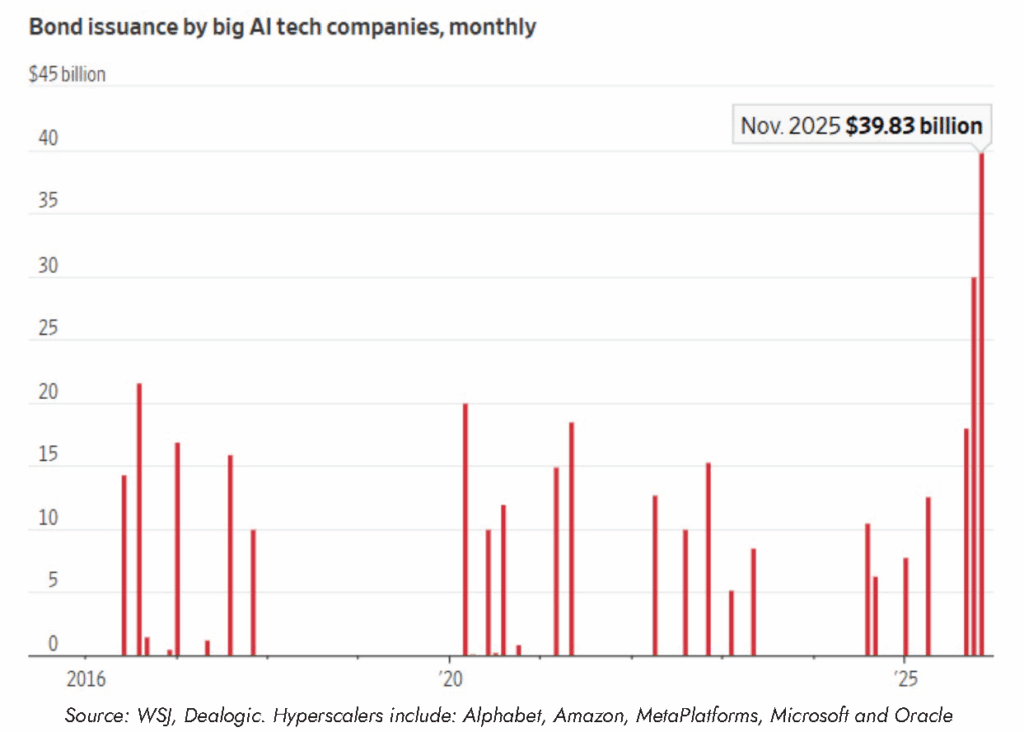
Magnificent 7 stocks, and particularly the smaller sub-set of Hyperscalers, are broadly defined as the market leaders in AI investment technologies. They have also powered the S&P 500 Index higher, as they become an increasingly large percentage of the index. To-date, these companies have had above-market earnings growth and reached an expected $500bn of capital expenditures in the next 12-months, having previously done so without significant use of debt and borrowing. That changed starting in September.
Since September, the Hyperscalers have issued nearly $90 billion of investment-grade bonds, more than they had sold over the previous 40 months. Investors are watching the shift from cash-flow funded to debt funded capital expenditures closely. It is important to note that earnings for these companies have largely kept up with share prices to-date; a difference from 1999-2000 when share prices rose rapidly ahead of earnings growth. However, given the highest concentration in over 50-years in the S&P 500 Index, investors continue to watch developments in artificial intelligence closely.
What’s on Deck for December?
The Federal Reserve Open Market Committee (FOMC) meets December 9-10 where they will announce any changes to policy. At time of writing, financial markets are pricing a roughly 85% chance of a 0.25% interest rate cut.
Investors continue to digest economic data following the end of the government shutdown. Some data releases over that period will not be released on a permanent basis.
Federal Reserve reduced interest rates for the first time since 2024 following weakening labor market data.
Declining interest rates helped drive US small cap stocks and bond markets higher during the quarter.
Investment in artificial intelligence drove the S&P 500 to record concentration levels as leadership narrowed in the Third Quarter.
What Happened in the Third Quarter?
The first interest rate cut since the end of 2024 and why it happened were important events in the Third Quarter of 2025. The Federal Reserve had been consistent with their messaging – interest rate cuts would largely be determined by any weakness in the labor market. During the quarter, there became signs the labor market was slowing down. There were large revisions to previous estimates of job creation, showing that the economy had created fewer jobs than first assumed. With inflation still comfortably above their 2% target, Federal Reserve officials were still comfortable reducing the Federal Funds Rate by 0.25% in September, reflecting the slowing jobs market. During the lead-up to the interest rate cut, equity markets were led by interest-rate sensitive markets such as small caps, which had strong results during the quarter (Russell 2000 TR Index rose +12.39%). Bond markets also benefitted from the decrease in interest rates, with the Bloomberg Barclays US Aggregate Bond TR Index rising +2.03% during the quarter. Leadership within the S&P 500 Index narrowed again during the quarter, as the largest companies (and most exposed to artificial intelligence investments) drove the index higher – detailed more below.
Index Diversification in the Spotlight One defining characteristic of the past three-to-five years in the US equity markets is the increasing concentration in the S&P 500. The degree to which the S&P 500 has narrowed has led to many investors asking “is an S&P 500 Index investment still diversified?”. By any measure – the S&P 500 Index is more concentrated in the largest companies than any other time since at least the mid-1960’s.
The top 10 companies in the S&P 500 make up 40% of the index market capitalization- meaning for every $1 invested in the S&P 500 Index, $0.40 goes into 10 companies. This compares to an average top 10 concentration closer to 23% over the past 30 years. Similar measures reflect the magnitude of concentration: Nvidia became the first 8% or greater position since IBM in 1969, Top 5 companies reached almost 28% of the index (highest since at least 1966).
The “why” of index concentration is also an important question- JPMorgan and Berkshire Hathaway are the only two Top 10 members that aren’t technology/technology-related companies. The significant capital expenditures related to artificial intelligence has shaped market composition: Magnificent 7 companies have doubled their annual capital expenditures since 2023. Investors will continue to be focused on the return-on-investment of this record investment, as well as the benefit to the other 490+ companies in the equity market.
Impact of US Dollar Trends
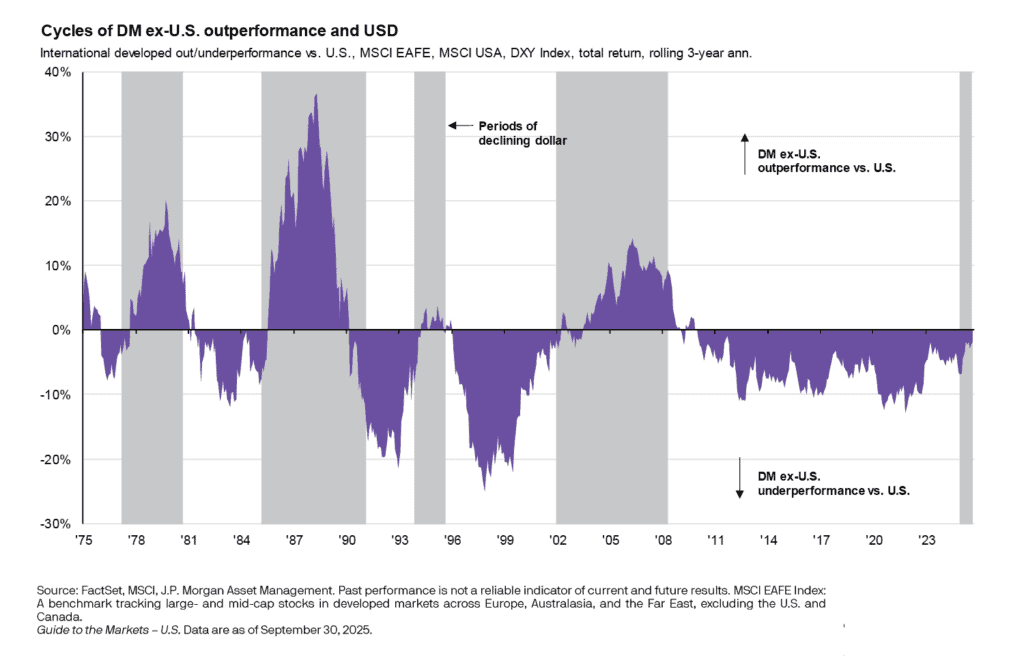
After falling almost -11% in posting its worst first half of a year since 1973, the US dollar rallied mildly during the Third Quarter. The weakness in the dollar has been a tailwind for international assets, such as international equities in investor portfolios. Converging growth rates and interest rate differentials globally, along with the high starting value of the US dollar heading into this year, leaves the possibility for an extended period of weakness, similar to 2002-2008. This period was also the last time international equities outpaced US equities for an extended period of time. Outside of currency trends, unlike the S&P 500 the international markets have a much lower degree of concentration in the largest companies: MSCI EAFE Index has roughly 12.7% of its market capitalization in the Top 10 holdings.
What’s Ahead for the Fourth Quarter?
Monetary policy is squarely in investors’ focus heading into the Fourth Quarter of 2025, with two subjects in focus. First, the path of interest rate cuts: what is the likely hood of additional interest rate cuts in 2025? With weakening in job market data in September, investors were assigning a high likelihood of rate cuts (0.25%) during the October and December Federal Reserve Open Market Committee meetings. This would mean an additional 0.50% reduction in short-term interest rates by the end of 2025, which would lower the yield on cash/cash-related investments (i.e. money market investments). Second, the composition of the Federal Reserve is also in focus, via both terms ending and attempts to replace members prior to the end of their respective term. This will have a significant impact on additional interest rate cuts heading into 2026.
As expected, the Federal Reserve reduced the Federal Funds rate by 0.25% today, the first rate cut since December 2024. What can investors expect going forward following the reduction in short-term interest rates? First off, some of the impact is “priced in” in advance of the actual rate cut, as investors and financial markets are forward-looking. That being said, there are some general reactions to expect:
Short-Term Savings and Liabilities
There will be a very tangible effect here – the yield or interest on short-term savings vehicles such as money market funds will drop relatively quickly to reflect the lower rate from the Federal Reserve.
Floating-rate loans (i.e. home equity lines of credit, securities-based loans, credit card loans) are often based on Secured Overnight Financing Rate (SOFR) (replaced LIBOR), which tracks Federal Funds rate closely. There should be a reduction in the interest on floating rate loans.
Mortgage Rates
Fixed rate mortgages are the dominant structure in the United States, and the impact of lower Federal Funds rate can be limited on 15-year and 30-year mortgages.
These types of fixed mortgages are based off the yield of longer-term Treasuries, plus a risk spread associated with underwriting and issuing the mortgages.
Longer-term Treasuries reflect expectations for future economic growth and inflation and are not set by the Federal Reserve.
This is also an example of investors pricing-in future events: 30-year mortgage rates hit their lowest level of the year before the interest rate cut was announced.
Stock and Bond Investments
The impact on the stock market can vary- certain sectors and size companies have a greater sensitivity to short-term interest rates. The catalyst for the rate cut is more important for the stock and bond markets- i.e. are the rate cuts due to an impending recession?
For example, small cap stocks use significantly greater floating rate financing compared to large cap stocks. Falling short-term interest rates are expected to boost small cap stock earnings. This is one reason why small cap stocks have outperformed large cap stocks in the US since June 30th.
Bond investments will generally benefit from the interest rate cuts but like fixed mortgages, the exact impact is more nuanced. When prevailing interest rates fall, the value of existing bonds increases in value. The benefit for bond investments will be reduced if longer-term yields stay higher or increase, similar to what happened after the rate cuts in 2024.
Rate cuts bring both opportunities and challenges, and staying informed and proactive can help you navigate the shifts with confidence. Since every situation is unique, we’d be glad to review how these changes may affect your goals—let’s start the conversation.
A Monthly Review of Investment Trends and Insights
Month in Review
Increased likelihood of an interest rate cut in September helped to push stocks higher, along with another quarter of strong earnings. The S&P 500 TR Index finished August +2.03% higher.
US small cap stocks led all equity markets higher, as the combination of inexpensive valuations and potential interest rate cuts proved to be a tailwind in August. The Russell 2000 TR Index rose +7.14% in August, bringing the return since 6/30/2025 to +9.00%.
Reversing July’s rally, the US Dollar fell again in August, providing an additional boost for international stocks denominated in US dollars. The MSCI EAFE NR USD Index rose +4.26% for the month, taking the YTD 2025 rally to +22.79%.
The likelihood of a September interest rate cut pushed short-term bond yields lower, helping to drive a +1.20% monthly rally for major bond markets (Bloomberg Barclays Aggregate Bond TR Index). It is important to note that longer-term bond yields actually rose slightly during the month.
Small Caps Shine in August
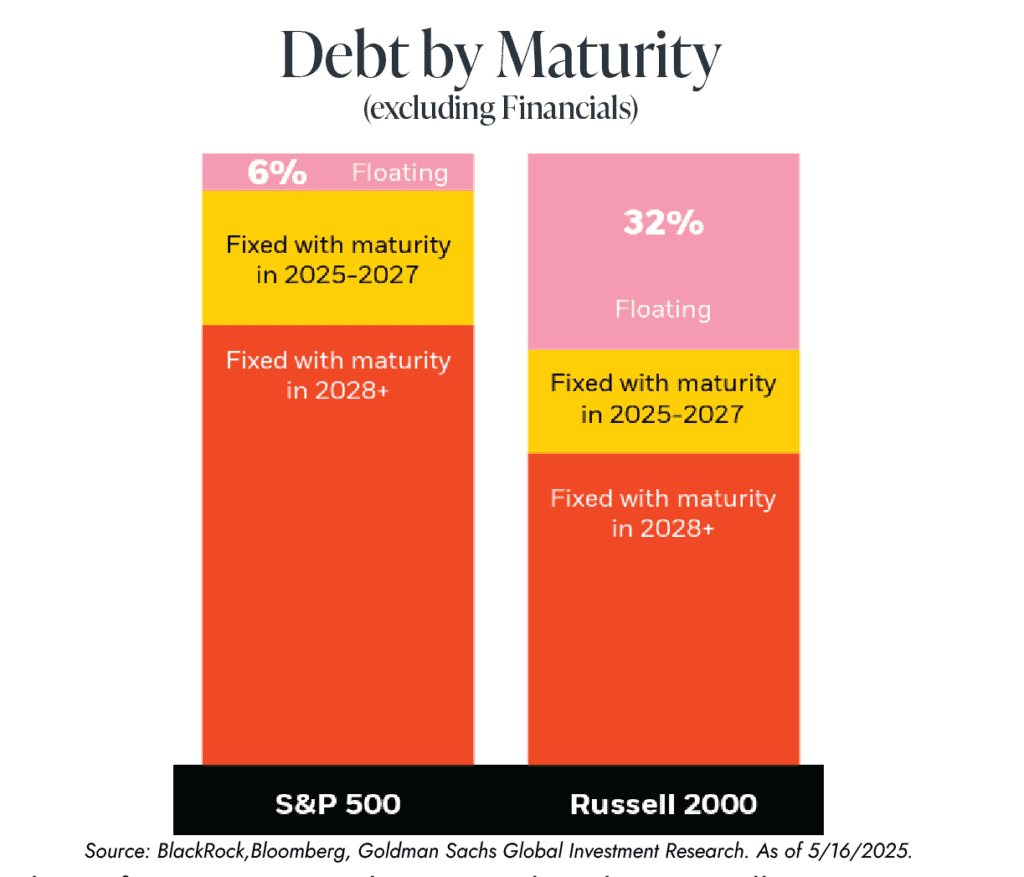
US small cap stocks, which are in the midst of one their longest period of underperformance versus US large caps, rallied sharply in August (Russell 2000 TR Index +7.14%, S&P 600 TR Index +7.06%). The primary reason – clarity around the now widely expected interest rate cut in September.
US small cap stocks have significantly greater exposure to short-term interest rates, having nearly 5x the amount of floating rate debt compared to the S&P 500 (chart below). Given that the Federal Funds Rate, the anchor for floating rate debt rates, has been above 4% since December 2022, small cap debt service costs have also been elevated. Effective annual debt cost for the Russell 2000 Index is closer to 7%, significantly higher than the effective rate for the S&P 500, which had more companies issue longer-term, fixed rate debt.
The nearly 12-year period of underperformance versus large caps has driven small caps to represent less than 4% of the overall US stock market, much lower than the 7% long-term average. The start of an interest rate cutting cycle is one element that could benefit small cap stocks. Their valuations are also much lower than US large cap stocks, which could also be a tailwind if the economy continues to expand, and catalyze increased representation of small caps.
What’s on Deck for September?
The Federal Reserve Open Market Committee (FOMC) announces their decision to change interest rates on September 17th. As of August 31st, markets are assigning a roughly 90% probability that the FOMC reduces the Fed Funds Rate by 0.25%.
The Federal Reserve staffing is also in the spotlight. In August, President Trump announced intentions to remove Fed governor Lisa Cook, on allegations of mortgage misrepresentation. No Fed governor has been fired since creation of the Federal Reserve in 1913. The outcome will be watched closely by investors as there are implications for Fed composition and approach to monetary policy.
Strong US earnings powered markets higher in July (+2.24%, S&P 500 TR Index), led by Technology and growth stocks. Microsoft joined Nvidia in becoming the second $4tn market cap company in history.
US large cap growth stocks finished the month up +3.78% (Russell 1000 Growth TR Index), pushing concentration higher in US large cap indices. The top 10 companies in the S&P 500 Index now represent nearly 40% of the index, the most concentrated in at least 50 years.
Nvidia’s 8% weight in the S&P 500 as of 7/31/2025 is unusually high relative to the history of the index. For comparison, the 8% weight of the single company is nearly equal to the weight of the entire Industrials Sector in the S&P 500 index.
International stocks fell -1.40% (MSCI EAFE NR USD Index) during July, as the US Dollar rose sharply against most major currencies. The MSCI EAFE NR USD Index still stands at +17.77% YTD.
Major bond markets fell slightly in July (-0.26%, Bloomberg Barclays Aggregate Bond TR Index), as investors digested the outlook for the economy and monetary policy.
Diversification with Bonds
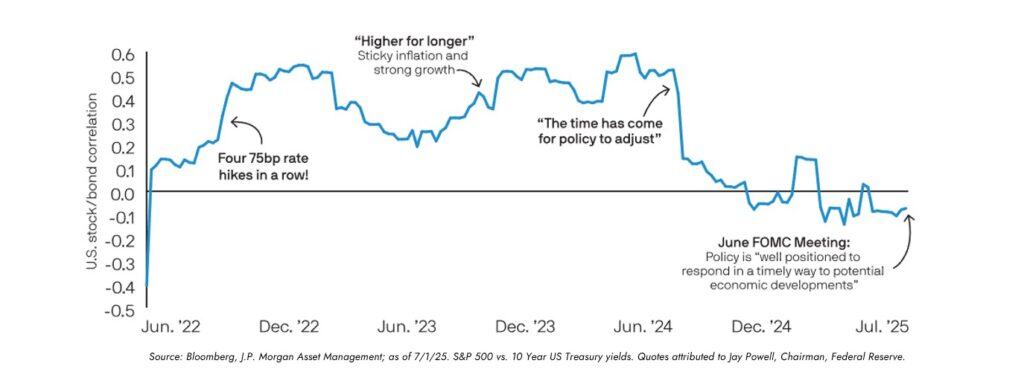
The sharp increase in inflation rates in 2021-2022 not only resulted in a significant drawdown for bond indices, but also sharply shifted the relationship between stock and bond prices. The correlation of US stocks and bonds increased to the highest level in 30 years in 2022, which had real implications for investors: the bond allocation did not provide a ballast during the equity market volatility.
Historically, periods of sustained higher inflation have resulted in a positive correlation between US stocks and bonds (meaning a reduced diversification benefit). From 2001 to 2022, the short- and long-term correlation between US stocks and bonds stayed negative, meaning bond prices rose when stock prices fell. After resetting higher to positive territory in 2022, recent short-term correlation measures have recently shifted negative again, as the Federal Reserve has begun to normalize monetary policy.
The chart illustrates the one-year correlation between US stocks and bonds, annotated with monetary policy developments. As investors have become more comfortable with the inflation outlook, the diversification benefit of bonds is beginning to return to portfolios.
What’s on Deck for August?
Second quarter of 2025 earnings reports will wrap-up in August. Through July 28th, 32% of the S&P 500 companies had reported, 77% beat earnings estimates with a reported earnings growth of +5.5% year/year.
The Federal Reserve Open Market Committee (FOMC) left interest rates unchanged in July. The Committee does not have a regular committee meeting in August; rather they have their annual symposium at Jackson Hole. Investors will be monitoring the meeting and communication for any insight as to the likelihood of an interest rate cut in September.
Trade policy will again be front-of-mind as the August 1st deadline approaches for trade deal negotiations.
Easing geopolitical and trade pressures helped to lift equities higher in June, as corporate fundamentals continued to show signs of improvement.
The US Dollar (DXY Index) fell -10.8% for the year ending June 30th, marking the sharpest first half decline for the currency since 1973. This provided a boost to US investors holding international assets, as detailed below.
The S&P 500 completed its recovery from its roughly -19% decline, making new all-time highs and standing at +6.20% YTD (S&P 500 TR Index). In June, US small cap stocks (Russell 2000 TR Index) and US large cap growth (Russell 1000 Growth TR Index) stocks rose +5.44% and +6.38% respectively.
Long-term interest rates declined from highs during the month, which helped to push major bond markets higher. The Bloomberg Barclays Aggregate Bond TR Index rose +1.54% during the month of June.
Income Opportunity in International Equities
International equity markets are enjoying a strong start to 2025, with the broad-based MSCI All Country World Ex-USA Index (“MSCI ACWI Ex-USA”) returning +17.90% in 2025 through June 30th. The depreciation of the US dollar has provided a significant boost to US investors holding US dollar denominated international exposure, adding over 9% to YTD 2025 results versus local currency international equities (MSCI ACWI Ex-USA Local Currency).
In addition to the benefits of currency diversification, there are attractive income opportunities for growth and income investors. The MSCI ACWI Ex-USA has a trailing dividend yield of 2.86%, compared the S&P 500’s trailing dividend yield of 1.28%. The S&P 500’s dividend yield is below its long-term average, reflecting underlying trends within the index. Within the S&P 500, only 14.7% of the Index has a yield greater than 3%, compared to 27.7% for the Russell 1000 Value and 45.8% for the MSCI ACWI Ex-USA Index. This largely reflects the increased concentration in more growth-focused sectors such as Technology and Communication Services within the S&P 500.
The currency diversification and higher dividend yield offered by international equities complements more growth-focused US equity exposure, a key tenant of maintaining diversified portfolios for long-term investors.
What’s on Deck for July?
As of time of writing, there is an early July deadline for re-negotiating outstanding trade deals. Progress on trade will be followed closely by investors.
The Federal Reserve Open Market Committee (FOMC) meets on July 29th and July 30th to decide any changes to policy and short-term interest rates. As of 6/30, there is a 21% chance of a 0.25% rate cut at the July meeting. The so-called “dot plots” released on June 18th indicate the FOMC is expecting to cut rates by 0.25% twice in 2025.
About the Author
Bill has more than 15 years of experience in the investment industry, most recently as Managing Director of Investments at a private wealth management firm. In his role at Confluence, Bill chairs the Investment Advisory Committee and develops and implements investment strategy for clients of the firm, as well as communicates investment content with clients.
April was a volatile month for stocks, bonds and currencies as investors digested the implications of rapidly changing trade policies.
After hitting a high level for 2025 on February 19th, the S&P 500 fell nearly 19% through April 8th. The index recovered from those levels, ending April down just -0.68% for the month and ending April at -4.92% YTD.
Other equity markets finished April on a stronger note, such as Developed International (MSCI EAFE NR Index) equities. The MSCI EAFE continued its strong 2025 through April, finishing the month up +4.58%, bringing YTD 2025 returns to +11.76%.
Outside of equity markets, the bond market recovered after a choppy start to April, with the Bloomberg US Aggregate Bond TR Index finishing April +0.39%, illustrating diversification benefits from bond allocations in portfolios.
US Dollar Decline
One surprise in 2025 has been the US dollar and the price movements versus other major currencies. Unlike major stock and bond markets which have recovered from late March/early April, the US dollar continues to fall versus major currencies. The US dollar depreciating, while US stocks are down, is a shift in behavior over the past 15-20 years: the US dollar had largely strengthened during times of uncertainty. The decline of the US dollar has had a significant impact on equity markets already in 2025: year-to-date international equities have outperformed the U.S. by the largest margin since 1993 (roughly 14%). While international valuations were cheaper, the shifting economic outlook and change in the US dollar made significant contributions to strong results YTD for international equities.
Investors are also weighing the impact of reduced international trade, something that is likely contributing to the US dollars decline. Any long-term reduction in trade could lessen demand for US dollars, another major long-term trend that could be shifting.
What’s on Deck for May?
Earnings for the first quarter of 2025 will be reported through May, with investors focusing on forward guidance given the changes in trade policy in 2025.
The Federal Reserve meets on May 7th, but markets are not expecting any change to interest rate policy at this meeting.
Ahead of the July extension, investors will be monitoring for any new trade deals.
Bill has more than 15 years of experience in the investment industry, most recently as Managing Director of Investments at a private wealth management firm. In his role at Confluence, Bill chairs the Investment Advisory Committee and develops and implements investment strategy for clients of the firm, as well as communicates investment content with clients.