Topic: Market Outlook

  • Stock Market Recap – February 2025

    Month in Review

    • After a positive start to 2025, equity markets were choppy in February following mixed economic data and increasing uncertainty.
    • In February, large cap stocks (S&P 500 TR Index) fell -1.30%, dragged slightly lower by large cap growth stocks (-3.59%, Russell 1000 Growth TR Index). Small cap stocks in the US also fell, with the Russell 2000 TR Index declining -5.35% in February.
    • Stock and bond markets were led by core bonds (+2.20%, Bloomberg US Aggregate Bond TR Index), developed international stocks (+1.94%, MSCI EAFE NR Index), and large cap value (+0.41%, Russell 1000 Value TR Index) during the month.

    Broadening Participation in the Bull Market

    With two months in the books, early in 2025 investors have seen signs of broadening participation in the bull market that started in October 2022. From an asset class lens, developed international stocks (MSCI EAFE NR Index) are off to a strong start this year, rising +7.30%, compared to +1.44% for the S&P 500 TR Index. Value stocks are also leading growth stocks in 2025, with the Russell 1000 Value TR Index rising +5.05% versus large cap growth (Russell 1000 Growth TR Index) falling -1.69%.

    Early in the year, investors can also see a shift within the S&P 500 Index itself. After being responsible for over 50% of the calendar year returns in 2024, 2023, and 2022, the so-called “Magnificent 7” stocks are trailing the rest of the index. In 2025, the S&P 500 excluding the Magnificent 7 stocks is up +3.2% YTD, and the average stock in the index is up +2.87% (S&P 500 Equal Weight TR Index), ahead of the overall index. One reason for this shift is the trade-off between the high valuations of the Magnificent 7 and the leveling-off of their earnings growth.

    Source: FactSet, Standard & Poor’s, J.P. Morgan Asset Management. The top 10 S&P 500 companies are based on the 10 largest index constituents at the beginning of each quarter. As of 2/28/2025, the top 10 companies in the index were AAPL (7.2%), NVDA (6.1%), MSFT (5.9%), AMZN (3.9%), GOOGL/GOOG (3.6%), META (2.9%), BRK.B (1.9%), AVGO (1.8%), TSLA (1.6%), and JPM (1.5%). The remaining stocks represent the rest of the 492 companies in the S&P 500.

    The largest companies in the S&P 500 are still expensive relative to their history at 27.3x forward earnings, even after seeing their valuations fall in 2025. Investors have started the year favoring opportunities with cheaper valuations, a trend that has helped diversified investors. 

    What’s on Deck for January?

    • As of February 28th, 97% of the S&P 500 had reported earnings for 4Q2024. Roughly 75% of the companies beat their earnings estimate and 63% exceeded their revenue estimates. Earnings growth for the quarter was a strong +18.2% year-over-year.
    • Investors will be watching for more certainty around the new trade policies being rolled out by the Trump administration.
    William Winkeler
    About the Author

    Bill has more than 15 years of experience in the investment industry, most recently as Managing Director of Investments at a private wealth management firm. In his role at Confluence, Bill chairs the Investment Advisory Committee and develops and implements investment strategy for clients of the firm, as well as communicates investment content with clients.

  • Stock Market Recap: January 2025

    Month in Review

    • Markets started off 2025 on a positive note, led by a broader set of equity markets. For the month, developed international (MSCI EAFE NR USD) returned +5.26% and large cap value (Russell 1000 Value TR Index) returned +4.68%, leading all markets.
    • There were pockets of volatility during the month, caused by developments in artificial intelligence and changing trade policies.
    • Overall, diversified investors enjoyed January. Participation in the market broadened: the average stock (Equal-Weight S&P 500 TR Index) finished January +3.50%, ahead of market cap weighted index’s 2.78% return (S&P 500 TR Index). Large cap value finished +4.68% (Russell 1000 Value TR Index), ahead of large cap growth’s +1.98% return (Russell 1000 Growth TR Index).

    Stocks are Rarely Average

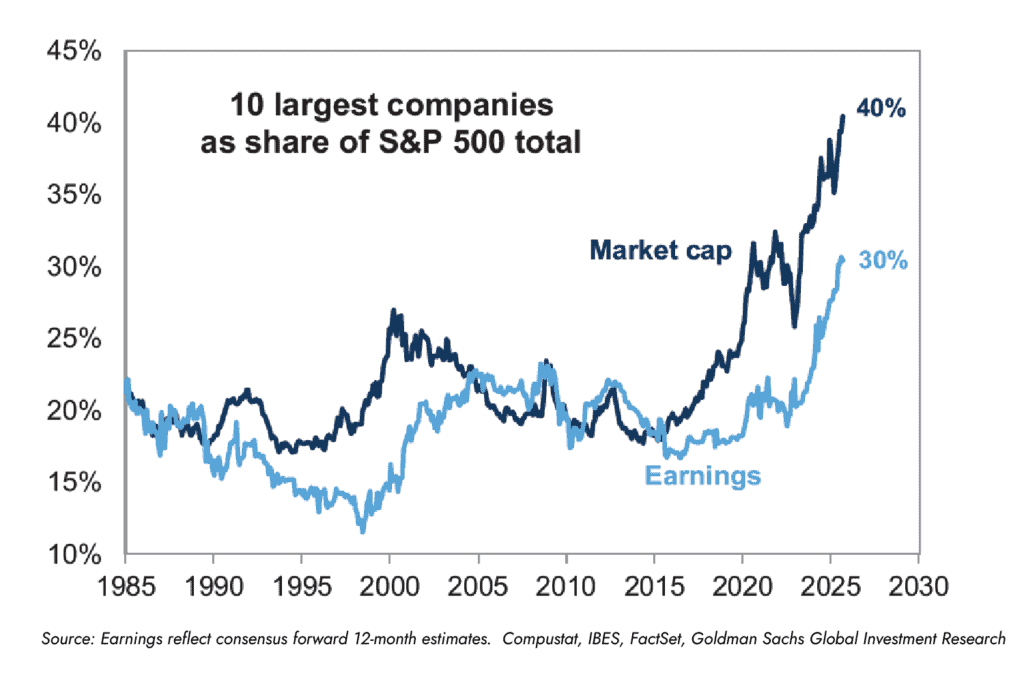
    Last year marked the second consecutive year the S&P 500 returned over 25%, making it only the fifth time since 1926 that the index has produced consecutive results of that magnitude. While there have been positive developments in 2025, the fact still remains that the S&P 500 is very concentrated in the top 10 companies, which have pushed the S&P 500’s valuation to above-average levels. How should investors think about this data?

    History is a great starting point, with over 100 years of various market conditions, recessions, and geopolitical headlines. History shows that stocks typically have “better-than-average” and “great” years in clusters, much like the S&P 500 has experienced recently. Since 1926, the S&P 500 has averaged 10.4% per year; during that period, it has only posted calendar year returns around the average (8% to 12%) in 6 years. This shows that over longer periods, fundamentals drive stock prices, not year-to-year price fluctuations- the benefit of being a long-term investor.

    In addition to understanding historical trends, investors should recognize the broadening out in the current bull market. In January, the S&P 500’s Technology sector was the only sector to fall during the month; the average stock also finished ahead of the index. Investors should view developments such as these favorably as the current bull market continues ahead.

    Source: Morningstar as of 12/31/24. U.S. stocks are represented by the S&P 500 Index from 3/4/57 to 12/31/24 and the IA SBBI U.S. Lrg Stock Tr USD Index from 1/1/26 to 3/4/57, unmanaged indexes that are generally considered representative of the U.S. stock market during each given time period.

    What’s on Deck for February?

    • Earnings season for the fourth quarter of 2024 will continue. As of February 2nd, 32% of S&P 500 companies have reported, with 74% beating earnings estimates and 62% beating revenue estimates.
    • The new Administration will continue to roll-out new policies, in addition to Congress working on budget and tax legislation.
  • Market Pulse: Quarter 4, 2024

    We are excited to share the inaugural version of Confluence Financial Partner’s Market Pulse: A Quarterly Review of Investment Trends and Insights. We aim to succinctly recap key investment trends and events on a quarterly basis, while providing insightful and actionable outlooks for the coming months. 

    Q4 2024 Insights: Three Key Takeaways

    Policy Shift: 2024 saw the Federal Reserve shift gears and lower interest rates, ending the rate hiking cycle that began in June 2022 and featured 9 rate hikes.

    Mega Leadership: Mega cap stocks, the largest companies in the US, pulled the S&P 500 to a second consecutive +25% annual gain, outpacing smaller stocks, international stocks, and bonds.

    High Concentration: The mega cap leadership resulted in a very narrow market by historical standards: the top 10 stocks in the S&P 500 represent over 38% of the index (highest in over 40 years).

    William Winkeler
    About the Author

    Bill has more than 15 years of experience in the investment industry, most recently as Managing Director of Investments at a private wealth management firm. In his role at Confluence, Bill chairs the Investment Advisory Committee and develops and implements investment strategy for clients of the firm, as well as communicates investment content with clients.

  • Stock Market Recap: November 2024

    • Markets rallied sharply in November following the US elections, with US small cap stocks leading all markets higher at +10.97% for the month (Russell 2000 TR Index). This represents the first all-time high for small caps in three years.
    • US large cap stocks also participated, with the S&P 500 TR Index rising +5.87% in November. The gains for large cap growth and large cap value were about even for the month.
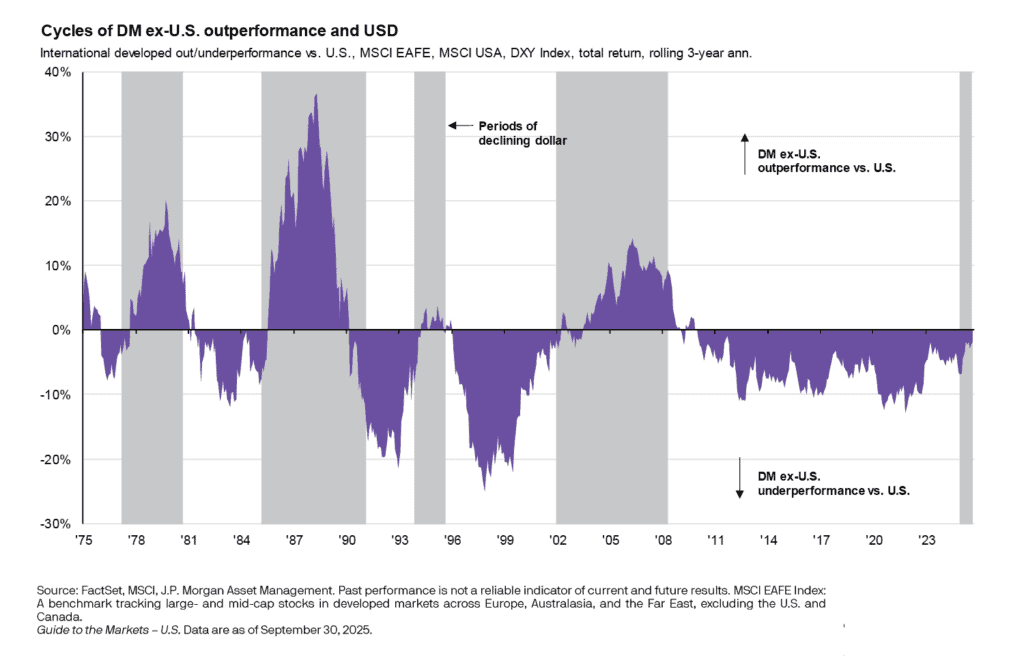
    • The strength of the US dollar weighed on international stocks, which fell slightly during the month (-0.57%, MSCI EAFE NR USD Index). After interest rates initially rose sharply, longer-term rates ultimately fell in November, resulting in a +1.06% gain for the bond market (Bloomberg Barclays Aggregate Bond TR Index).

    This year has been another strong year for equity markets, particularly US large-cap stocks. For example, the S&P 500 has made over 50 all-time highs in 2024, which is on pace for the fifth most in a calendar year since 1957. Through the end of November, it was also the strongest election year since 1936 for the S&P 500. What do investors have to look to as we head into 2025?

    In the very near-term, investors have the month of December. Going back to 1928, the S&P 500 has had a positive return 74% of all Decembers, the highest positive return rate of any month. The average monthly return of +1.3% in December is the second-best month of the calendar year, on average.

    There are also historical trends around US election cycles to consider. Since 1926, the S&P 500 has averaged +10.7% during the year after Presidential elections, slightly higher than the +10.4% for any given year. This trend largely reflects the ability for new administrations to enact legislative change prior to mid-term election years, which have historically had below-average results.

    Morningstar as of 10/31/24.  Stock market represented by the S&P 500 Index from 1/1/70 to 10/31/24 and  IA SBBI U.S. large cap stocks index from 1/1/26 to 1/1/70. Past performance does not guarantee or indicate future results. Index performance is for illustrative purposes only. You cannot invest directly in the index.

    • The Federal Reserve will announce any changes to policy on December 18th. As of December 2nd, the market is pricing a 65% chance of a 0.25% reduction in the Federal Funds Rate.
    William Winkeler
    About the Author

    Bill has more than 15 years of experience in the investment industry, most recently as Managing Director of Investments at a private wealth management firm. In his role at Confluence, Bill chairs the Investment Advisory Committee and develops and implements investment strategy for clients of the firm, as well as communicates investment content with clients.

  • Stock Market Recap: October 2024

    • October was a challenging month for stock and bond markets as bond yields rose sharply during the month. All major markets finished the month lower, with international equities and interest rate sensitive equities falling the most.
    • The S&P 500 finished October down slightly at -0.91% (S&P 500 TR Index), marking the first time in five months that the index has declined.
    • The yield of the 10-year US Treasury rose to +4.28% in October (+0.54% increase for the month), which weighed on bond market returns: the Bloomberg Barclays US Aggregate Bond Index fell -2.48% in October.

    The Federal Reserve began its interest rate cutting cycle in September, reducing the Federal Funds target rate by 0.50%. Historically, the start of an interest rate reduction policy has been associated with a decline in bond yields. Why is this? Typically, the Federal Reserve reduces interest rates to help support a slowing economy, whether its slowing due to changes in the business cycle, or an external event.

    This year has been an exception, compared to the seven easing cycles since 1989 (before 1989 Federal Reserve did not officially target interest rate changes). Since the September 18th rate cut, the 10-year Treasury yield has increased nearly 0.60%, the largest increase at this stage compared to the previous seven cycles. It is worth noting that 50-days after the first rate cut, during the previous seven cycles, the 10-year yield was either the same, or lower, than the start.

    What could be driving bond yields higher during the present cycle? It is likely the fact that inflation is declining, while the economy and jobs markets are still growing (at a slowing rate), similar to the 1995 soft landing outcome. Alternatively, it could be a sign that investors are concerned about the lack of any clear plan to address the US government’s fiscal situation. Measuring outstanding debt relative to annual economic growth, the United States has a debt-to-GDP ratio of 123%- meaning more debt outstanding than the rate of economic growth in a given year.

    Source: Yardeni Research, LSEG Datastream

    • US Election Day is on November 5th, which will be a closely followed affair.
    • Earnings season is well underway for the Third Quarter of 2024. Consensus estimates for year/year earnings growth for the S&P 500 was +4.3% for the quarter.
    William Winkeler
    About the Author

    Bill has more than 15 years of experience in the investment industry, most recently as Managing Director of Investments at a private wealth management firm. In his role at Confluence, Bill chairs the Investment Advisory Committee and develops and implements investment strategy for clients of the firm, as well as communicates investment content with clients.

  • Market Update – May 2022

    Though the market changes, our commitment to clients does not. Our Chief Executive Officer, Greg Weimer, and Director of Investments, Bill Winkeler, give you an update on the current market and share insights on how to navigate these times.

  • Stock Market Recap: September 2024

    • Stock and bond markets continued to rally in September, following the Federal Reserve’s first interest rate cut.
    • Gains expanded beyond market leaders, such as large cap growth and technology stocks, with broader participation within the S&P 500, large cap value, small cap stocks, and international stocks.
    • The S&P 500 Index total return of +22.08% year-to-date as of September 30th represents its best start to a year since 1997, and the best start to a Presidential election year in its history.

    The Federal Reserve reduced the Federal Funds Rate by 0.50% as expected in September, ending the rate hiking cycle that began in March 2022 and featured over 5% worth of interest rate increases. 

    The market’s outlook largely shifted in early July, when the June inflation report affirmed the outlook for declining inflation, clearing the way for the September rate cut. Since that period, stock and bond market leadership has shifted as the economic and fundamental outlook has changed.

    Since June 30th (after the inflation report and rate cut), market leadership has broadened beyond the Magnificent 7 stocks. The Equal-Weighted S&P 500 Index rose +9.60%, ahead of the market-cap weighted S&P 500 TR Index (+5.89%). Within large cap stocks, large cap value gained +9.43%, ahead of large cap growth’s +3.19% gain. Small cap stocks also participated in broadening, with the Russell 2000 TR Index rising +9.27% during the third quarter. Lastly, core bonds (Barclays US Agg Bond TR Index) rose +5.20%, pulling ahead of money market funds in 2024 as short-term rates begin to decline. The changing environment highlights how dynamic financial markets can be and serves as a reminder of the importance of maintaining a diversified approach to investing.

    Sources: Morningstar, June 30th to September 30th . Average S&P 500 Stock = S&P 500 Equal Weighted TR Index, Large Cap Value = Russell 1000 Value TR Index, Small Cap = Russell 2000 TR Index, Developed International = MSCI EAFE NR Index, S&P 500 = S&P 500 TR Index, Core Bonds = Bloomberg US Agg Bond TR Index, Large Cap Growth = Russell 1000 Growth TR Index.

    • Labor market data will be watched closely as investors look for information ahead of the Federal Reserve’s meetings in November and December.  
    William Winkeler
    About the Author

    Bill has more than 15 years of experience in the investment industry, most recently as Managing Director of Investments at a private wealth management firm. In his role at Confluence, Bill chairs the Investment Advisory Committee and develops and implements investment strategy for clients of the firm, as well as communicates investment content with clients.

  • Stock Market Recap: August 2023

    Month in Review

    • Major stock indices broke a two-month streak of gains, with all major indices finishing down for the month.
    • Growth companies regained favor after two months of value and small cap companies leading the market.
    • Bond prices declined due to rising interest rates.

    Insight on Inflation

    Despite the market volatility, evidence from July’s inflation report suggests progress towards a “soft landing” scenario, where inflation is gradually decreasing, and the economy avoids a recession. In July, headline inflation was at +3.3%, year-over-year, down from its peak of 9.1% in June 2022. Unlike June 2022, supply chains and goods have largely normalized, with wages and services being the key drivers of inflation today.

    Source: BLS, FactSet, J.P. Morgan Asset Management. CPI used is CPI-U and values shown are % change vs. one year ago. Core CPI is defined as CPI excluding food and energy prices. The Personal Consumption Expenditure (PCE) deflator employs an evolving chain-weighted basket of consumer expenditures instead of the fixed-weight basket used in CPI calculations.  Guide to the Markets – U.S. Data are as of August 31, 2023.

    What’s on Deck for September?

    • The August jobs report supplied additional evidence towards a “soft landing” outcome – more people joined the workforce while wage growth slowed, indicating steady but slower economic growth.
    • A “soft landing” could lead to the Federal Reserve not needing to raise interest rates as high as previously predicted, potentially benefiting stocks and bonds.
    • Investors will now pay close attention to the September and November Federal Reserve meetings for clues about future rate hikes or general shifts in policy.

    Download the August 2023 Market Recap below:

    William Winkeler
    About the Author

    Bill has more than 15 years of experience in the investment industry, most recently as Managing Director of Investments at a private wealth management firm. In his role at Confluence, Bill chairs the Investment Advisory Committee and develops and implements investment strategy for clients of the firm, as well as communicates investment content with clients.

  • Stock Market Recap: October 2023

    Month in Review

    • Stocks fell during the month of October, marking the third straight monthly decline for the S&P 500 Index.
    • Bond markets also fell again during the month, the fifth straight monthly decline for the asset class.
    • Concerns over US government funding helped keep interest rates higher in October, pressuring stock and bond markets again.
    • US corporate earnings season is also in full swing, with over 50% of the S&P 500 having reported by the end of the month. Companies have thus far reported positive earnings growth with mixed outlooks.

    Last Rate Hike? Now What?

    The Federal Reserve held its November committee meeting, where they kept interest rates unchanged. Following the press conference, investors are now expecting interest rates to be unchanged again in December (only a 15% probability of a December rate hike as of 11/2/2023).  If the Federal Reserve is finished increasing interest rates this cycle, what does that mean for the stock market? Going back to 1929, there are no clear trends, the range of outcomes following the last hike is very wide historically. While various talking heads remain hyper-focused on short-term events such as this, it is more important than ever that investors maintain their focus on long-term fundamentals.  

    What’s on Deck for November?

    • The autoworkers strike appears to be nearing resolution, while a potential government shutdown remains a possibility ahead of the November 17th deadline.
    • Corporate earnings season is nearly two-thirds complete, with companies reporting earnings ahead of estimates on average, and clocking positive growth this quarter. Investors will focus on forward guidance from companies as the season wraps-up.
    • The next Federal Reserve meeting is not until December 13th, so in the interim investors will continue to look for communications and sign-posts for confirmation the Federal Reserve is done increasing interest rates. The Federal Reserve did confirm their on-going effort to reverse their quantitative easing (QE) program, which is expected to keep interest rates elevated.

    Download the October 2023 Market Recap below:

    William Winkeler
    About the Author

    Bill has more than 15 years of experience in the investment industry, most recently as Managing Director of Investments at a private wealth management firm. In his role at Confluence, Bill chairs the Investment Advisory Committee and develops and implements investment strategy for clients of the firm, as well as communicates investment content with clients.

  • Stock Market Recap: November 2023

    Month in Review

    • Stocks rose sharply in November, breaking a three-month losing streak. Gains were broad based across major markets.
    • Bond markets also broke a five-month losing streak, posting strong results as short- and long-term interest rates fell significantly during November.
    • Multiple data points illustrated that inflation is in continued decline, raising investor confidence that the Federal Reserve is done hiking and turning its focus to potential rate cuts in 2024. 

    A November to Remember!

    November was a month to remember for investors: The S&P 500 posted its strongest November since 1980 (rising roughly 9%) and the Barclays Aggregate Bond Index had its best month since May 1985 (rising roughly 4.5%).

    What were the catalysts for such a sharp reversal?

    Investor sentiment had become overly negative – a three-month losing streak for stocks and a 5-month losing streak for bonds. This set-up was followed by unexpected positive developments on the fight against inflation. Multiple readings during November showed inflation rising by less than expectations. Federal Reserve officials also affirmed progress towards normalizing inflation, the decline can be seen in the exhibit below. The positive developments on inflation drove interest rates lower, sending stock and bond prices higher, as investors now shift their attention away from rate hikes to rate cuts.  

    Source: BLS, FactSet, J.P. Morgan Asset Management. CPI used is CPI-U and values shown are % change vs. one year ago. Core CPI is defined as CPI excluding food and energy prices. The Personal Consumption Expenditure (PCE) deflator employs an evolving chain-weighted basket of consumer expenditures instead of the fixed-weight basket used in CPI calculations. Guide to the Markets – U.S. Data are as of November 30, 2023.

    What’s on Deck for December?

    • Earnings season is wrapped up and government shutdown issues have been pushed out until January 19th and February 2nd of 2024.
    • The Federal Reserve meeting on December 13th will be watched closely for comments on the timing and magnitude of the first rate cut and the on-going shrinking of the Fed’s balance sheet. At time of writing, futures markets are implying a 50% chance of a 25bps rate cut during the March 20th, 2024 meeting.
    • As we enter 2024, the US Presidential election will once again be a focus. Despite a significant amount of noise, it is important to remember that the S&P 500 has only had negative returns in election years two of the last 20 election years (2000, 2008).

    Download the November 2023 Market Recap below:

    William Winkeler
    About the Author

    Bill has more than 15 years of experience in the investment industry, most recently as Managing Director of Investments at a private wealth management firm. In his role at Confluence, Bill chairs the Investment Advisory Committee and develops and implements investment strategy for clients of the firm, as well as communicates investment content with clients.